
Our performance
The Regulator of Social Housing has introduced a new set of performance indicators for all social housing landlords, including local authorities, to measure their performance against.
The indicators are known as the Tenant Satisfaction Measures (TSMs) and cover things that are important to tenants, such as satisfaction with services, repairs, safety and complaints. The TSMS help us understand our performance and where we need to improve.
Below are the TSMs and our performance against them. It’s good to compare our performance with others, so we’ve included a ‘benchmark’ so that you see how we are doing. This benchmark is the mid-point or ‘median’ for London councils.
|
Satisfaction survey TSMs |
Westminster April – Dec 2024 |
Westminster |
RSH London |
|---|---|---|---|
|
Satisfaction survey TSMs Overall service from their landlord |
Satisfaction survey TSMs 67.9% |
Westminster April – Dec 2024 65.7% |
60.3% |
|
Satisfaction survey TSMs Landlord listens to tenants’ views and acts on them |
Satisfaction survey TSMs 64.2% |
Westminster April – Dec 2024 61.5% |
51.4% |
|
Satisfaction survey TSMs Landlord keeps them informed about things that matter to them |
Satisfaction survey TSMs 81.3% |
Westminster April – Dec 2024 83.1% |
66.7% |
|
Satisfaction survey TSMs Landlord treats them fairly and with respect |
Satisfaction survey TSMs 79.7% |
Westminster April – Dec 2024 77.9% |
70.1% |
|
Satisfaction survey TSMs Their home is well maintained |
Satisfaction survey TSMs 65.8% |
Westminster April – Dec 2024 65.2% |
60.9% |
|
Satisfaction survey TSMs Overall repairs service over the last 12 months |
Satisfaction survey TSMs 64.9% |
Westminster April – Dec 2024 65.7% |
63.5% |
|
Satisfaction survey TSMs Time taken to complete their most recent repair |
Satisfaction survey TSMs 64.3% |
Westminster April – Dec 2024 63.7% |
61.7% |
|
Satisfaction survey TSMs Their home is safe |
Satisfaction survey TSMs 70.9% |
Westminster April – Dec 2024 69.6% |
66.8% |
|
Satisfaction survey TSMs Landlord makes a positive contribution to the neighbourhood |
Satisfaction survey TSMs 77.4% |
Westminster April – Dec 2024 76.0% |
62.5% |
|
Satisfaction survey TSMs Landlord keeps communal areas clean and well maintained |
Satisfaction survey TSMs 77.3% |
Westminster April – Dec 2024 79.2% |
62.4% |
|
Satisfaction survey TSMs Landlord’s approach to ASB case handling |
Satisfaction survey TSMs 65.2% |
Westminster April – Dec 2024 63.6% |
58.3% |
|
Satisfaction survey TSMs Landlord’s approach to handling complaints |
Satisfaction survey TSMs 29.6% |
Westminster April – Dec 2024 26.7% |
26.0% |
|
Management information TSMs |
Westminster April - Dec 2024 |
Westminster |
RSH London |
|---|---|---|---|
|
Management information TSMs % stage 1 complaints responded to in target time |
Management information TSMs 79.9% |
Westminster April - Dec 2024 46.2% |
74.8% |
|
Management information TSMs % stage 2 complaints responded to in target time |
Management information TSMs 72.7% |
Westminster April - Dec 2024 25.8% |
70.8% |
|
Management information TSMs Number of stage 1 complaints per 1000 homes |
Management information TSMs 66.2 |
Westminster April - Dec 2024 89 |
100 |
|
Management information TSMs Number of stage 2 complaints per 1000 homes |
Management information TSMs 29.0 |
Westminster April - Dec 2024 20 |
18 |
|
Management information TSMs Number of ASB cases opened per 1000 homes |
Management information TSMs 10.9 |
Westminster April - Dec 2024 25 |
54.3 |
|
Management information TSMs Number of ASB cases that involved hate incidents opened per 1000 homes |
Management information TSMs 0.3 |
Westminster April - Dec 2024 2 |
1.2 |
|
Management information TSMs Non-emergency repairs completed in target time |
Management information TSMs 78.5% |
Westminster April - Dec 2024 70.9% |
78.7% |
|
Management information TSMs Emergency repairs completed in target time |
Management information TSMs 95.9% |
Westminster April - Dec 2024 90.5% |
92.1% |
|
Management information TSMs Proportion of homes that do not meet the Decent Homes Standard |
Management information TSMs 5.91% |
Westminster April - Dec 2024 2.40% |
17.6% |
|
Management information TSMs Fire risk assessments |
Management information TSMs 99.98% |
Westminster April - Dec 2024 97.3% |
99.7% |
|
Management information TSMs Gas safety checks |
Management information TSMs 99.67% |
Westminster April - Dec 2024 99.3% |
99.8% |
|
Management information TSMs Lift safety checks |
Management information TSMs 100% |
Westminster April - Dec 2024 100% |
98.5% |
|
Management information TSMs Water safety checks |
Management information TSMs 100% |
Westminster April - Dec 2024 100% |
99.6% |
|
Management information TSMs Asbestos safety checks |
Management information TSMs 100% |
Westminster April - Dec 2024 88.0% |
100% |
How we’re improving
We are performing well compared to other London councils for most of the measures, but we know we can do better. Our management information TSMs are seeing a sustained improvement which is showing that the work we are doing to improve our services is on the right track.
We have increased monitoring of complaints, introduced a repairs complaints team, and are improving our digital systems for managing complaints which is helping with our timeliness in responding to complaints.
We have also made significant changes to our repairs service, including a new repairs policy, new teams to support vulnerable residents, improving record keeping, introducing new training for staff and ways to keep residents updated throughout the process.
We have an improvement plan in place and we know that there is more for us to do as we continue work with residents to redesign our service with the aim of improving resident experience.
To find out more of how we are improving our service , please see our Housing Services Annual Report 2023-2024.
Summary of approach - how we measure satisfaction
The below information relates to our 2023/24 data collection, we will update this section at the end of each year so you can see how our final performance was collected.
The regulator has set rules for measuring the TSMs which we have followed carefully. Over the last year we’ve surveyed our tenants and collected management information so that we can report figures accurately. Here’s the summary of our approach to the TSM survey which we sent to the regulator.
How we measure tenant satisfaction
We employed Kwest Research, a market research company that specialises in social housing, to carry out the tenant satisfaction survey for us. Each month tenants were selected at random for the survey. Anyone who has told us they don’t want to complete surveys or we had already surveyed were taken out.
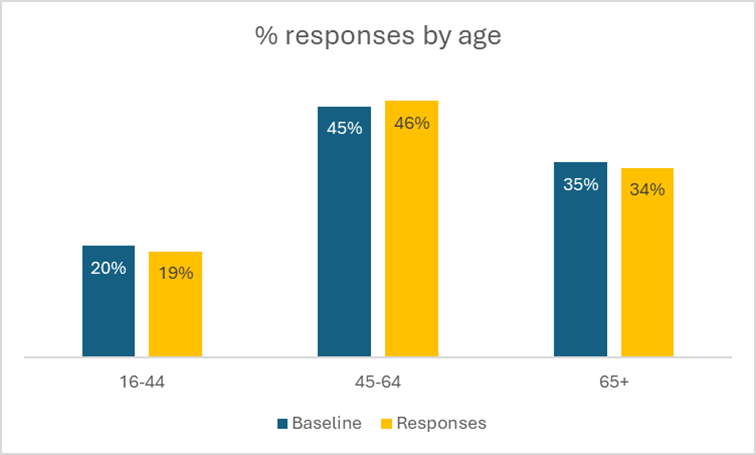
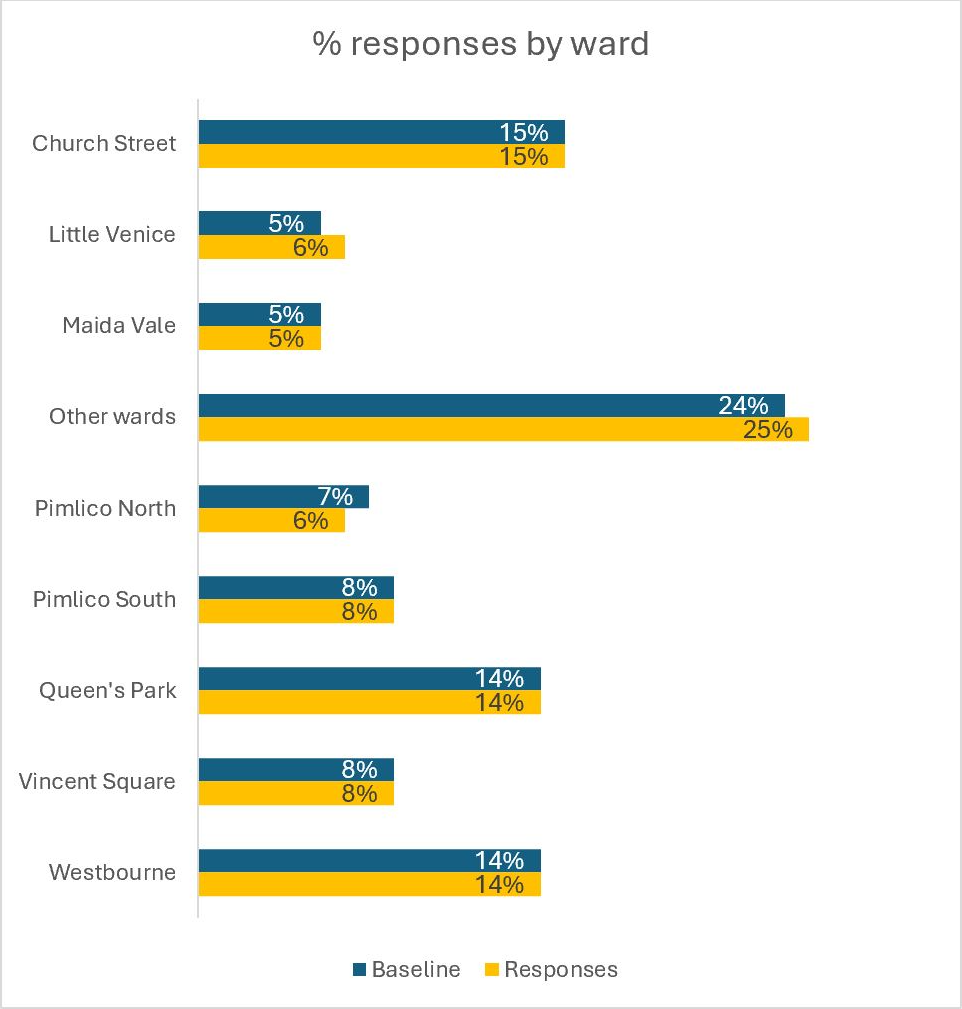
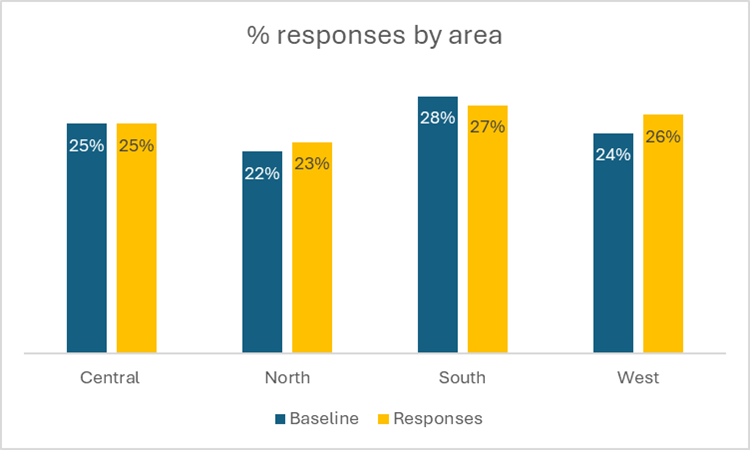
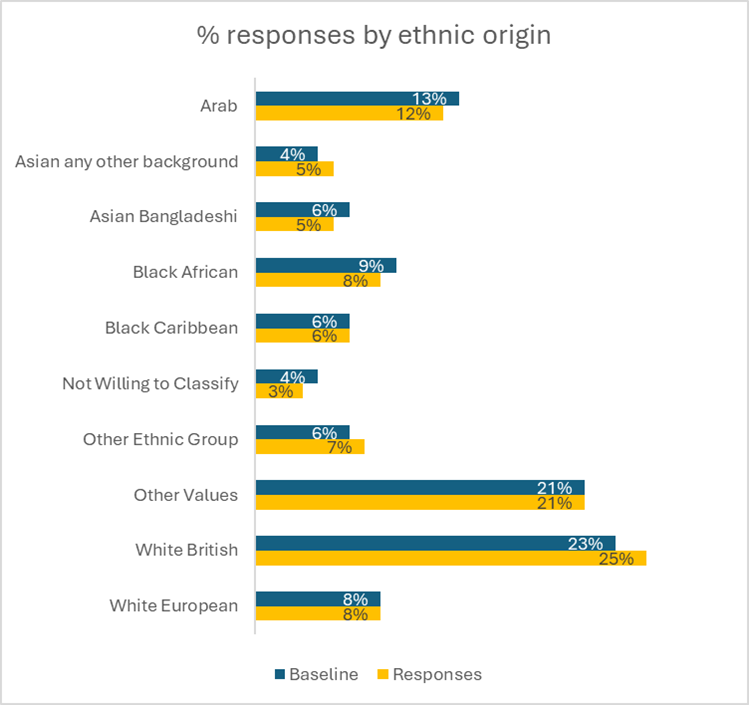
How we make sure data is representative of all tenants
We monitor who takes part in the survey by age, ethnicity, gender and area of the city in which they live to make sure the survey is representative. Here’s a breakdown of our tenants who responded to the survey. The baseline represents all tenants for whom we hold data. The responses and baseline are very close showing that those who took part were representative of our tenants overall.
How was the survey carried out?
The survey was carried out by phone to make it as accessible as possible. Kwest Research have staff who speak languages other than English and carrying out the survey by phone also removes any barriers caused by literacy issues. Kwest Research used the questions provided by the Regulator (Q2-Q16), plus a few questions added at the end by the Council to improve understanding (Q17-20). See the survey questions for more details:

How many people took part?
We surveyed 1,441 tenants between June 23 and March 24.
How reliable are the results?
Statistically the results are reliable to plus or minus 2.4%. To explain what this means, let’s take tenant satisfaction with the overall service which scored 65.7%. With reliability at plus or minus 2% we know that the actual satisfaction of our tenants is somewhere between 63.7% and 67.7%. This is a very good level of reliability and meets the requirements of the Regulator of Social Housing.
